|
|
Computer Simulation:
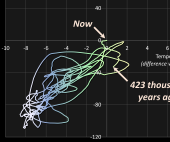
| Real life (1):
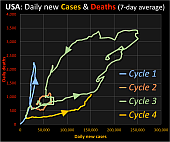
| Real life (2):
| Real life (3):
|
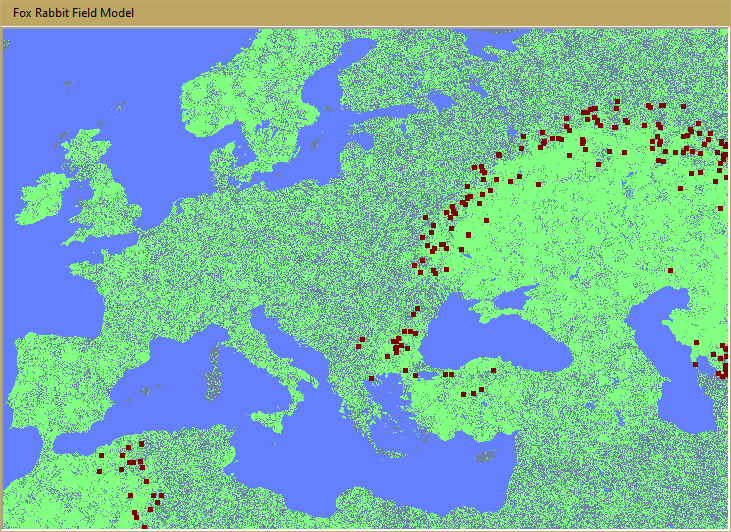
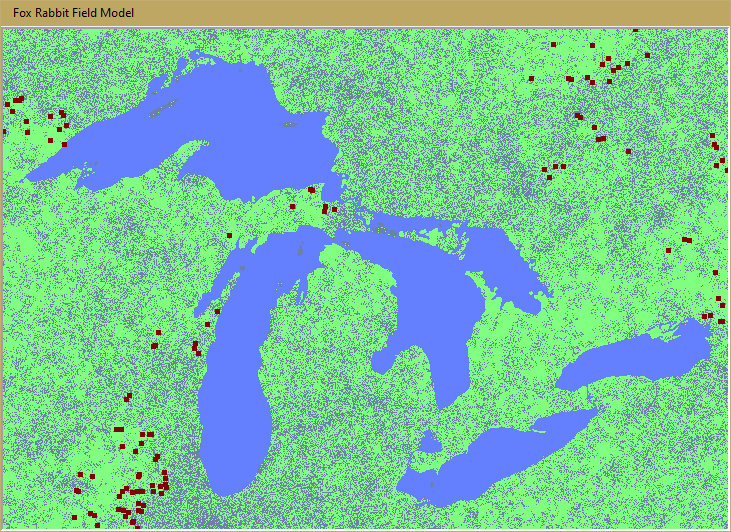
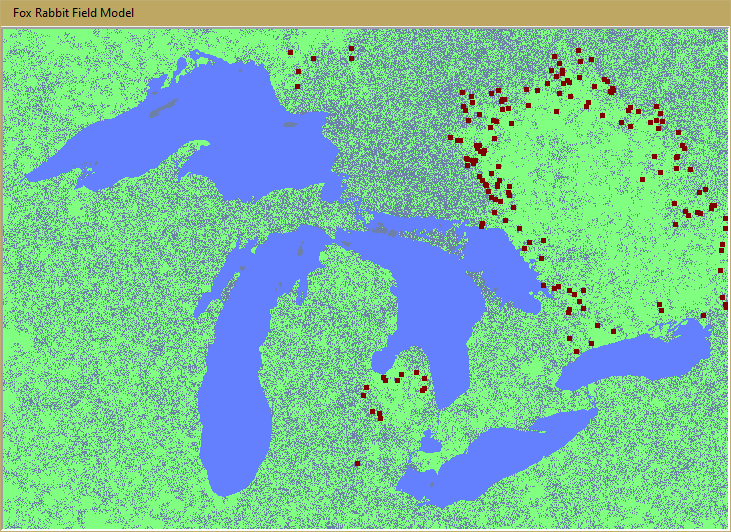
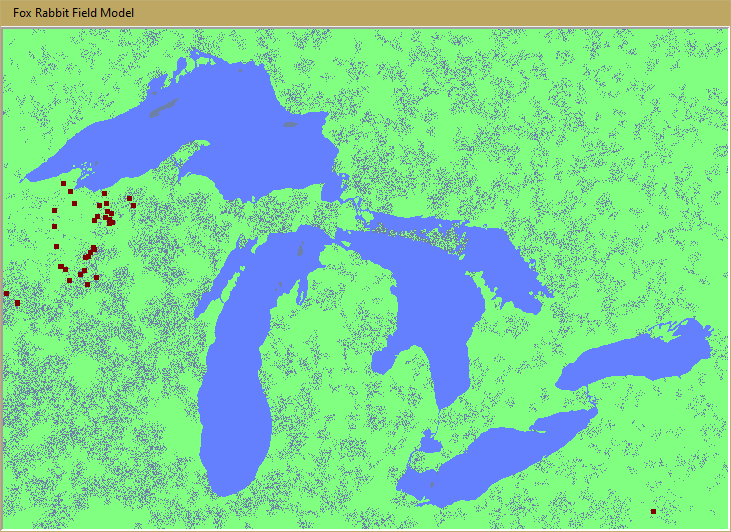
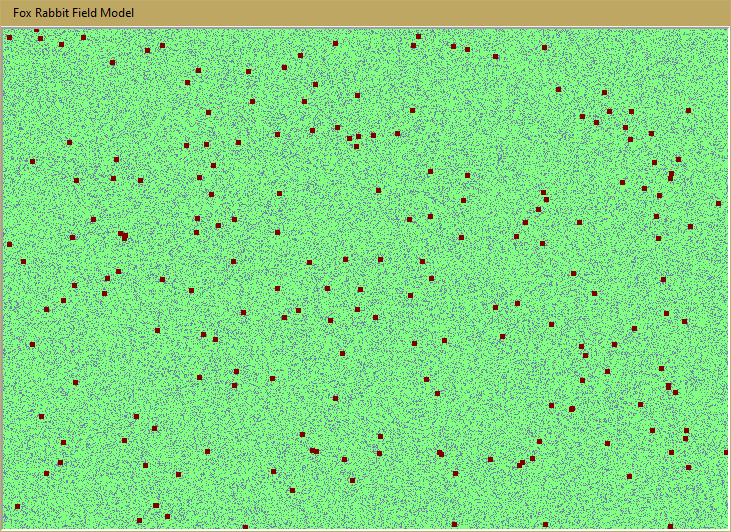
Imagine: a region filled with grass. Think of e.g. Europe (as in the image above), or just a rectangular field (as shown below), or anything else. Grass grows everywhere. On land, that is, because the region may partly be filled with water: oceans, seas, or lakes.
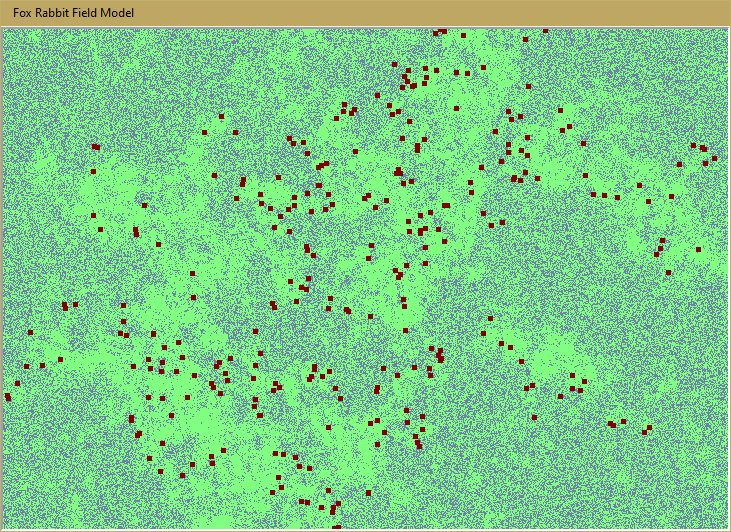
 Everywhere where grass grows. rabbits grow too. As it goes with rabbits, they multiply; and the speed at which their population grows is directly proportional with the local number that is alive. In other words: the more rabbits you have, the more rabbits you get.
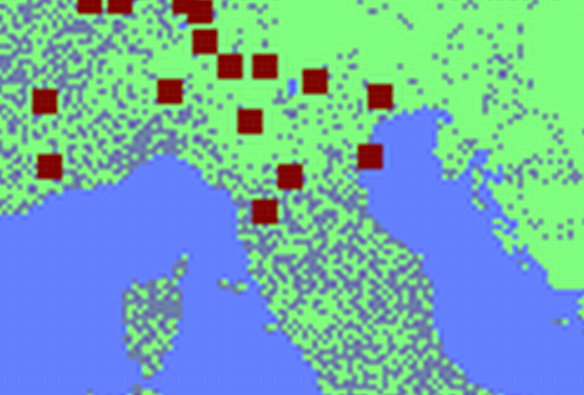
In the maps in the program, the rabbits are visible as small dark-blue dots. Very small: you may think you are watching, say, dust or so, but they are rabbits, if you can believe it. The close-up on the right shows them a little bit more clearly.
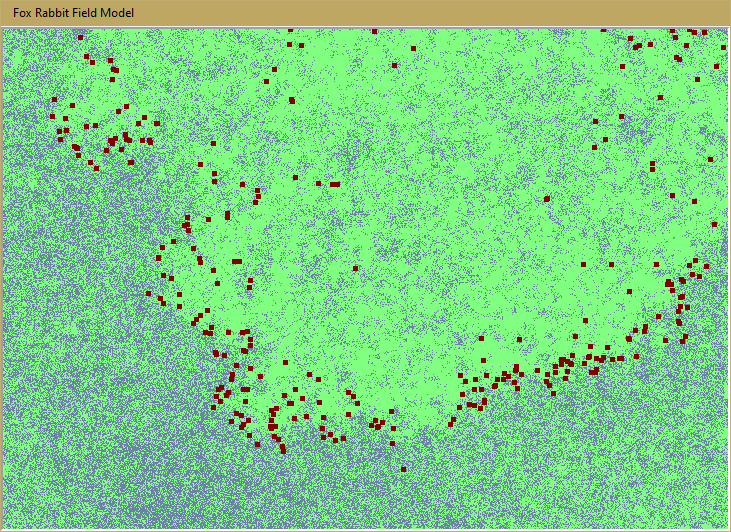
This may sound as a paradise for the rabbits. But alas, there are foxes too. Foxes eat rabbits. When they do, the number of rabbits locally decreases, evidently. Besides: if foxes succeed in eating enough rabbits to grow very strong, they multiply.
The foxes are shown in the maps as larger red squares: you can see them more easily as individual creatures.
Fox behavior in this program is very simple. The program goes through a loop of events. In every loop, or 'timestep', each fox does this:
- First it sees if there are one or even two rabbits within jumping distance (i.e. a couple of pixels on the screen).
- If so, the fox tries to jump to them, catch them and devour them. However, this is not always successful.
- If, thanks to consuming one or two rabbits, the strength of the fox reaches at least at a certain minimum level, it procreates. This is not a very thrilling event, as the foxes in this program are not male or female. Hence, sex is very simple: a new fox pops out and starts doing the same as its parent.
- If no rabbit is within jumping distance, the fox suffers. It loses strength.
- If the strength gets below a certain minimum level, the fox dies. It vanished from the screen.
- If the fox does not eat and does not die, it jumps a few pixels in a random direction. Yes, they are not very smart. (They don't jump into the water: they are not that silly.)
 That's it. In other words, the fox does not:
- Make any plans for the future.
- Coordinate its actions with other foxes. Actually, it ignores all other foxes completely.
- See any rabbits beyond its (very small) jumping distance.
- Evolve, improve, learn, practice, etc.
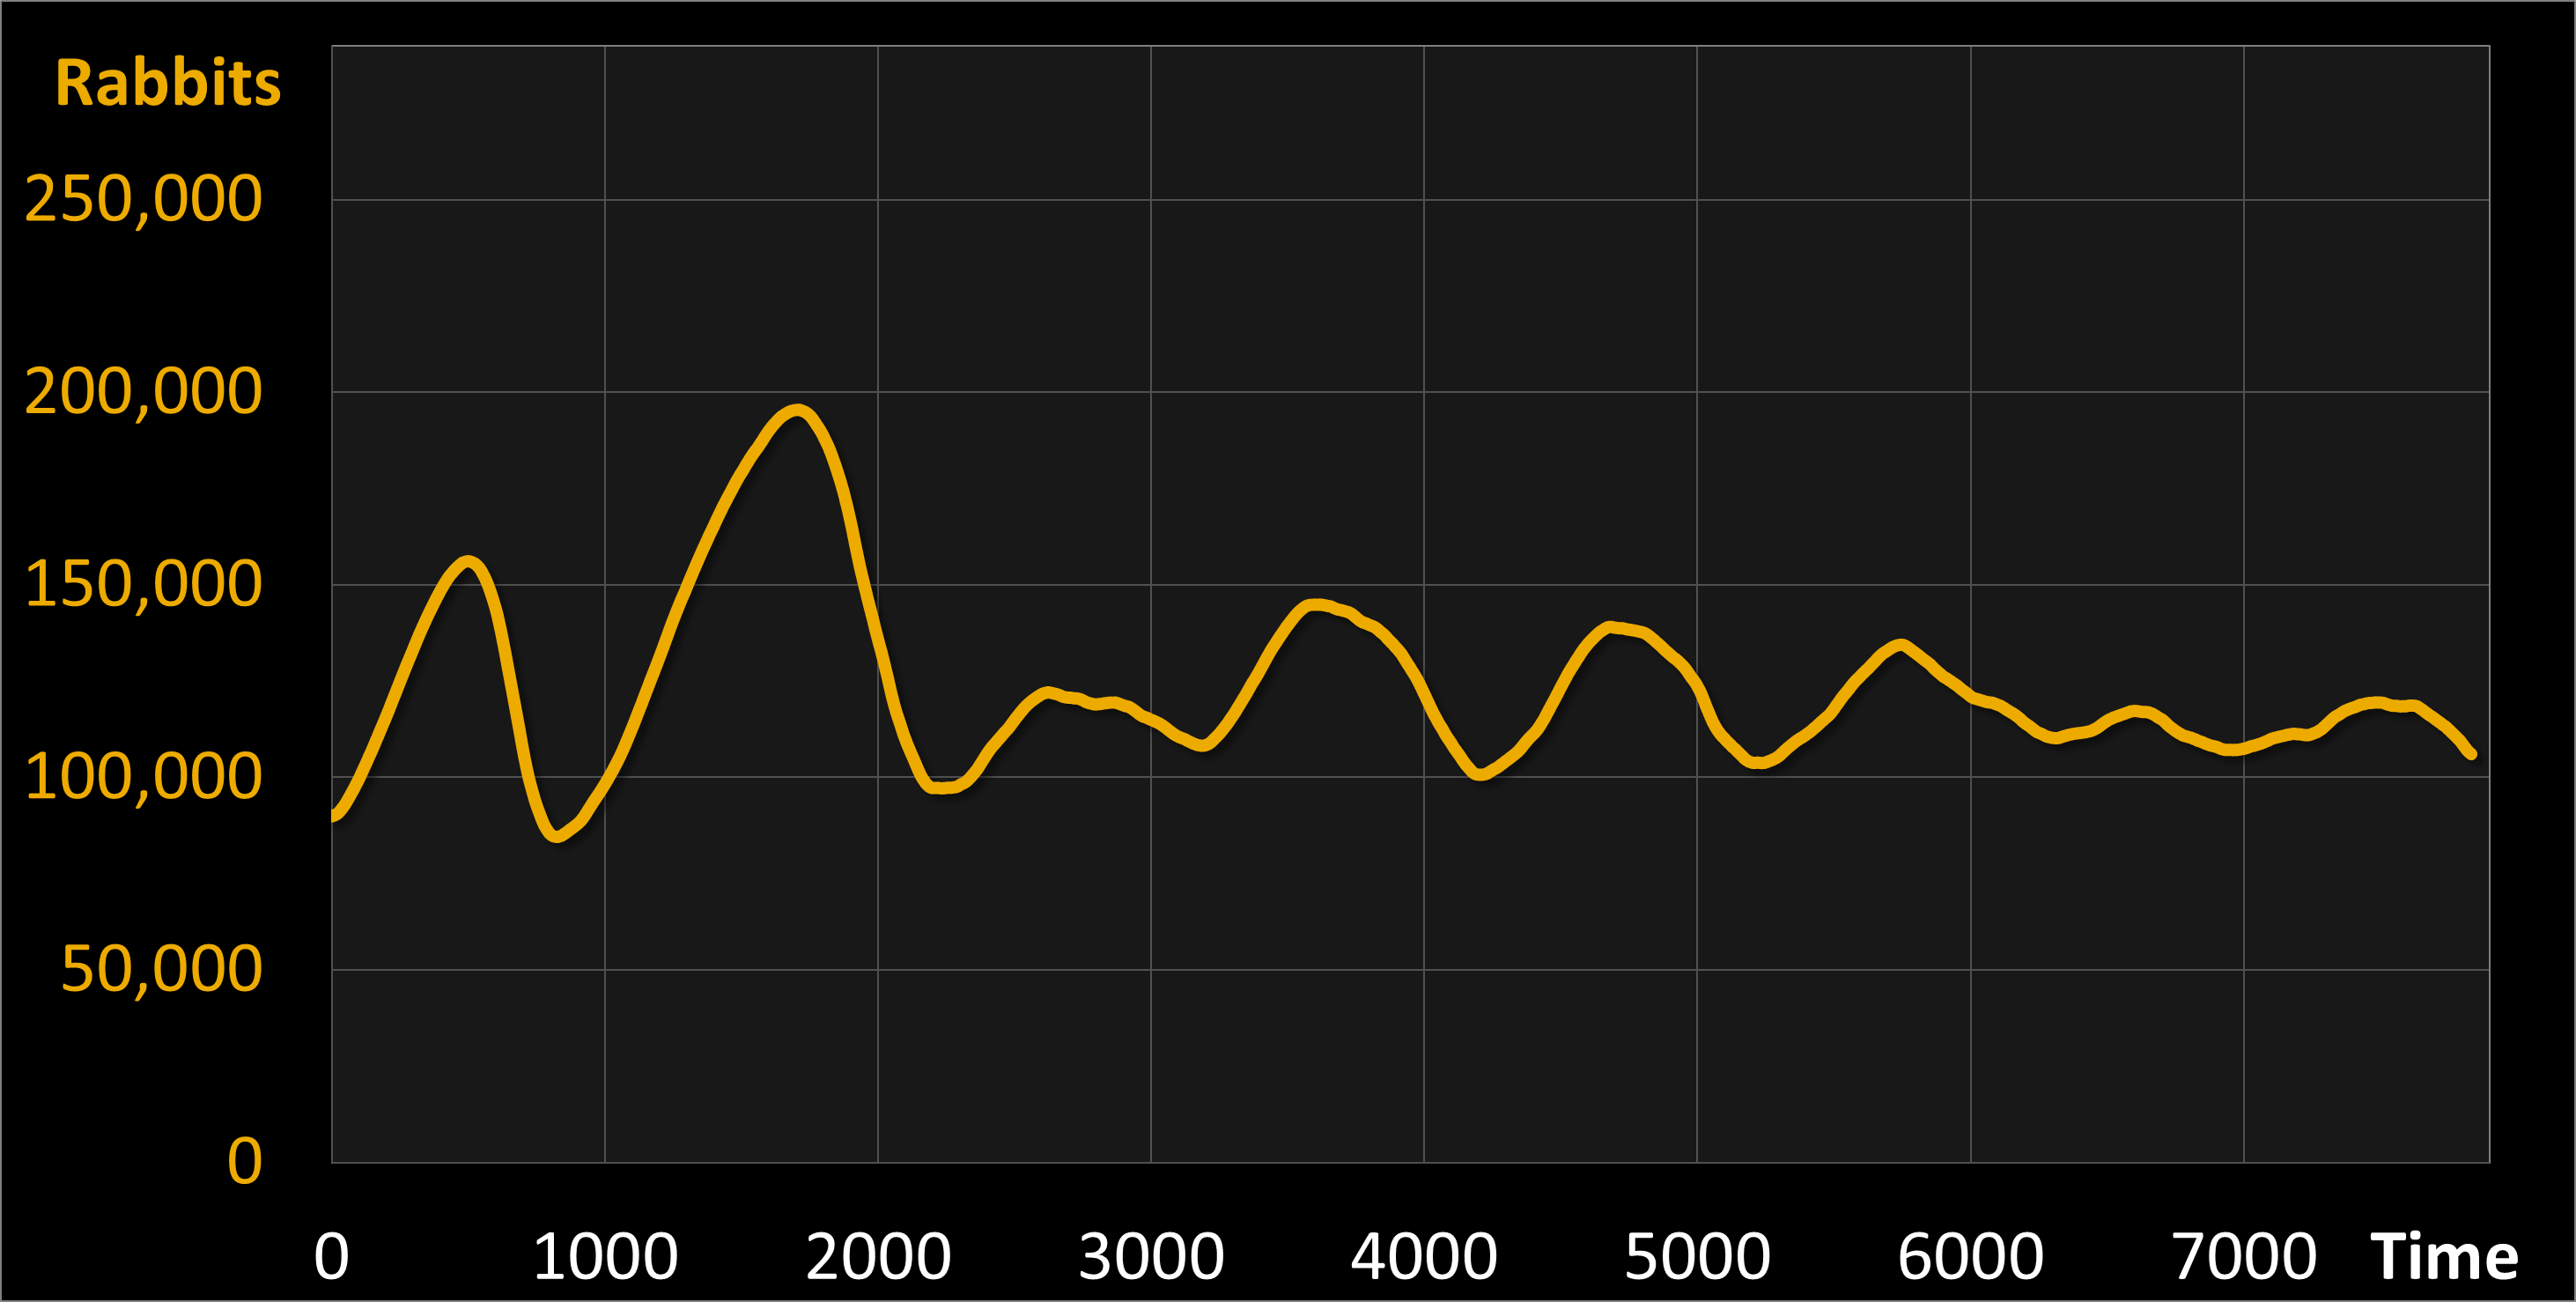
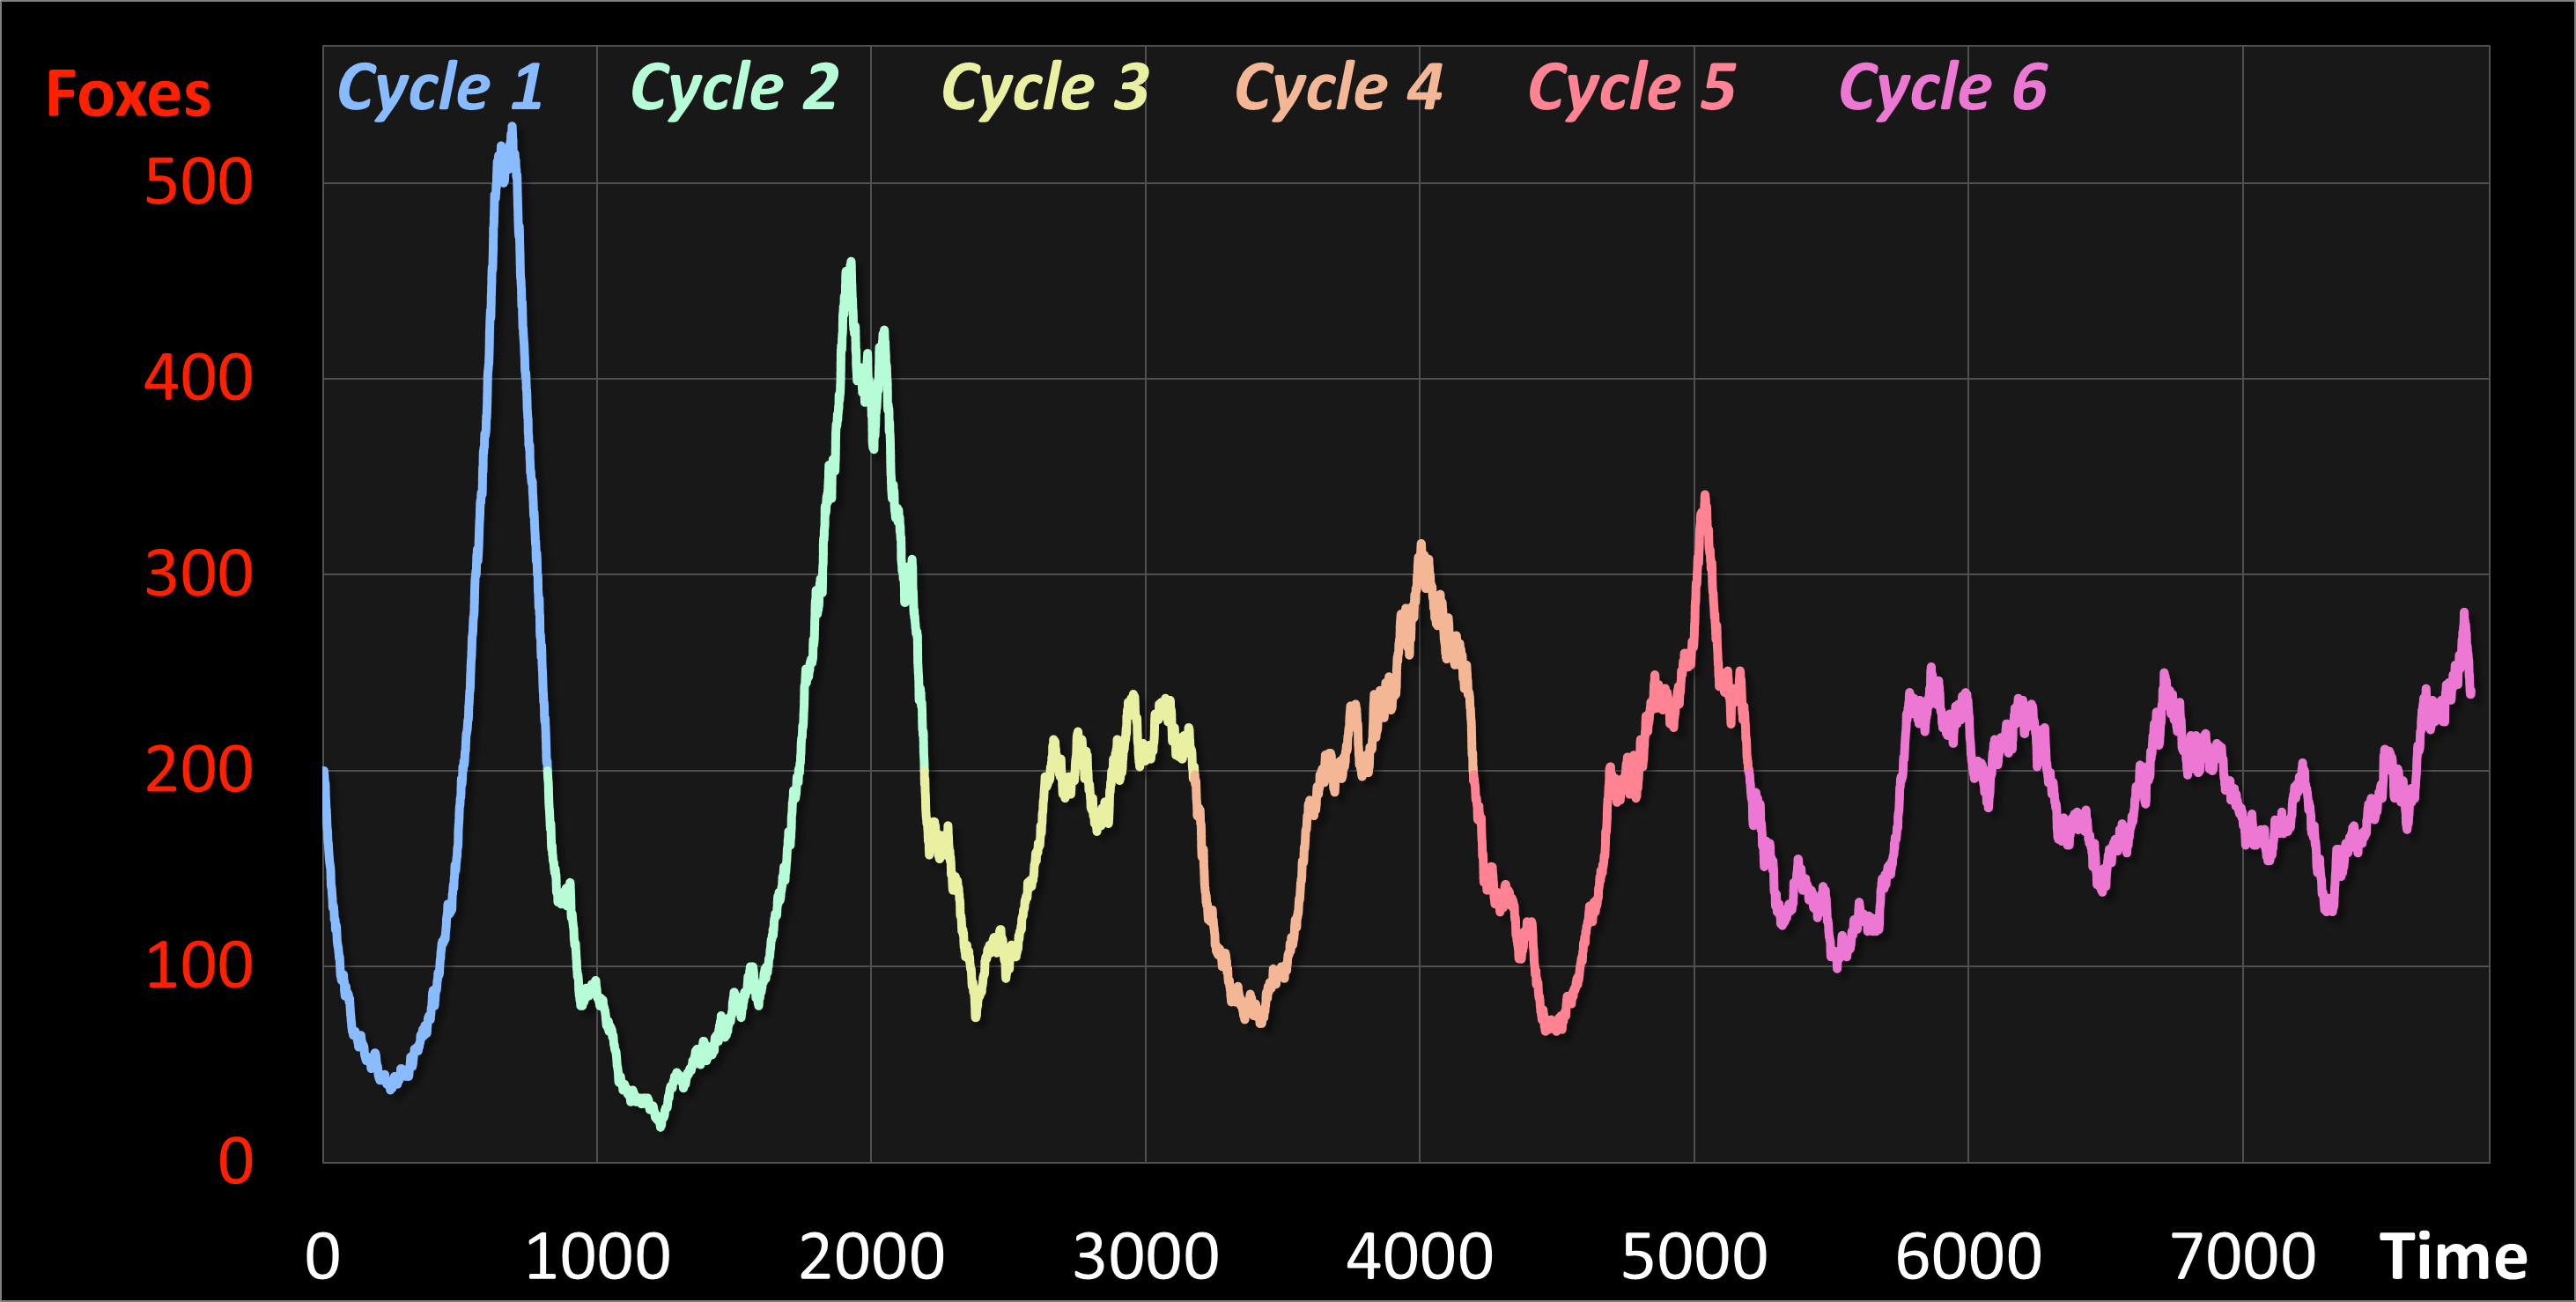
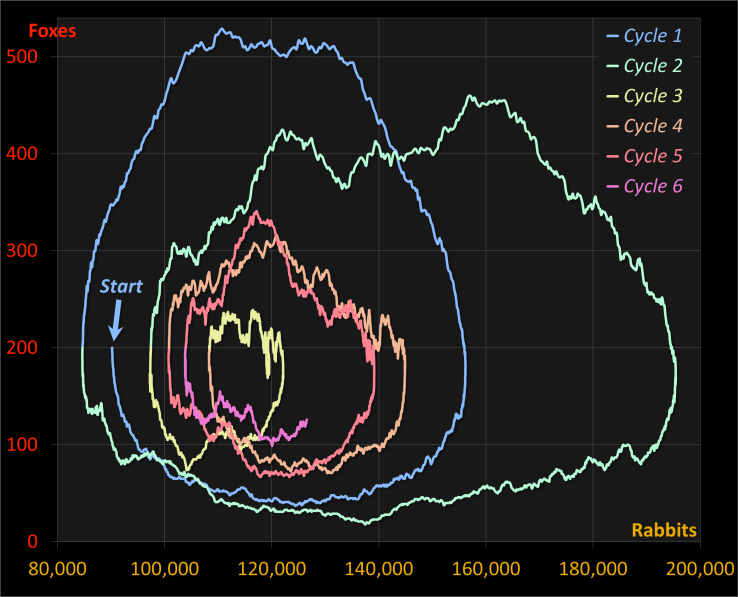
It is fascinating to compare the development that unfolds when the process is started, with the one that the Math Model exhibits. The mechanism is very different: where the Math Model is simply based on a set of two mathematical formulae, the A-life model simulates the process in a kind of 'natural environment' where 'real' (virtual) foxes hunt their preys. Below, the two processes are compared in more details.
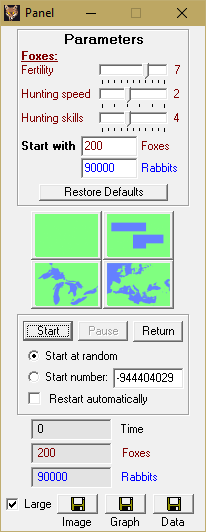
The program enables the user to perform experiments. The landscape can be changed: it can be selected out of four different regions, as shoen on the left. Two of them show a remarkable resemblance with existing geographic regions: the European continent, and the American Great Lakes district.
The initial number of rabbits and foxes can also be changed.
Besides, some characteristics of the foxes can be adapted. There are three parameters:
- Fertility: the minimum strength required to procreate. If the parameter is lowered, the foxes will be more fertile and produce more offspring.
- Hunting speed: the distance a fox is able to jump, expressed in pixels on the screen.
- Hunting skills: the likelihood that the foxes will be able to catch rabbits when they make their jumps towards them.
Varying these three parameters, the user is able to investigate the following question:
'Is it true, that a species of animal is more successful if it is (1) more fertile, (2) faster
and (3) more skilled?'
|
|
|
|