Real life (1): Lynxes and Snow Hare in Canada See also: |
|
|
Computer Simulation:
| Computer Simulation:
| Real life (2):
| Real life (3):
|
The two theoretical Fox Rabbit models (Math Model and Field Model) yield fascinating results based on the computer simulations. A logical question is of course, to what extent the behavior of predators and their prey shown in these models actually occurs.
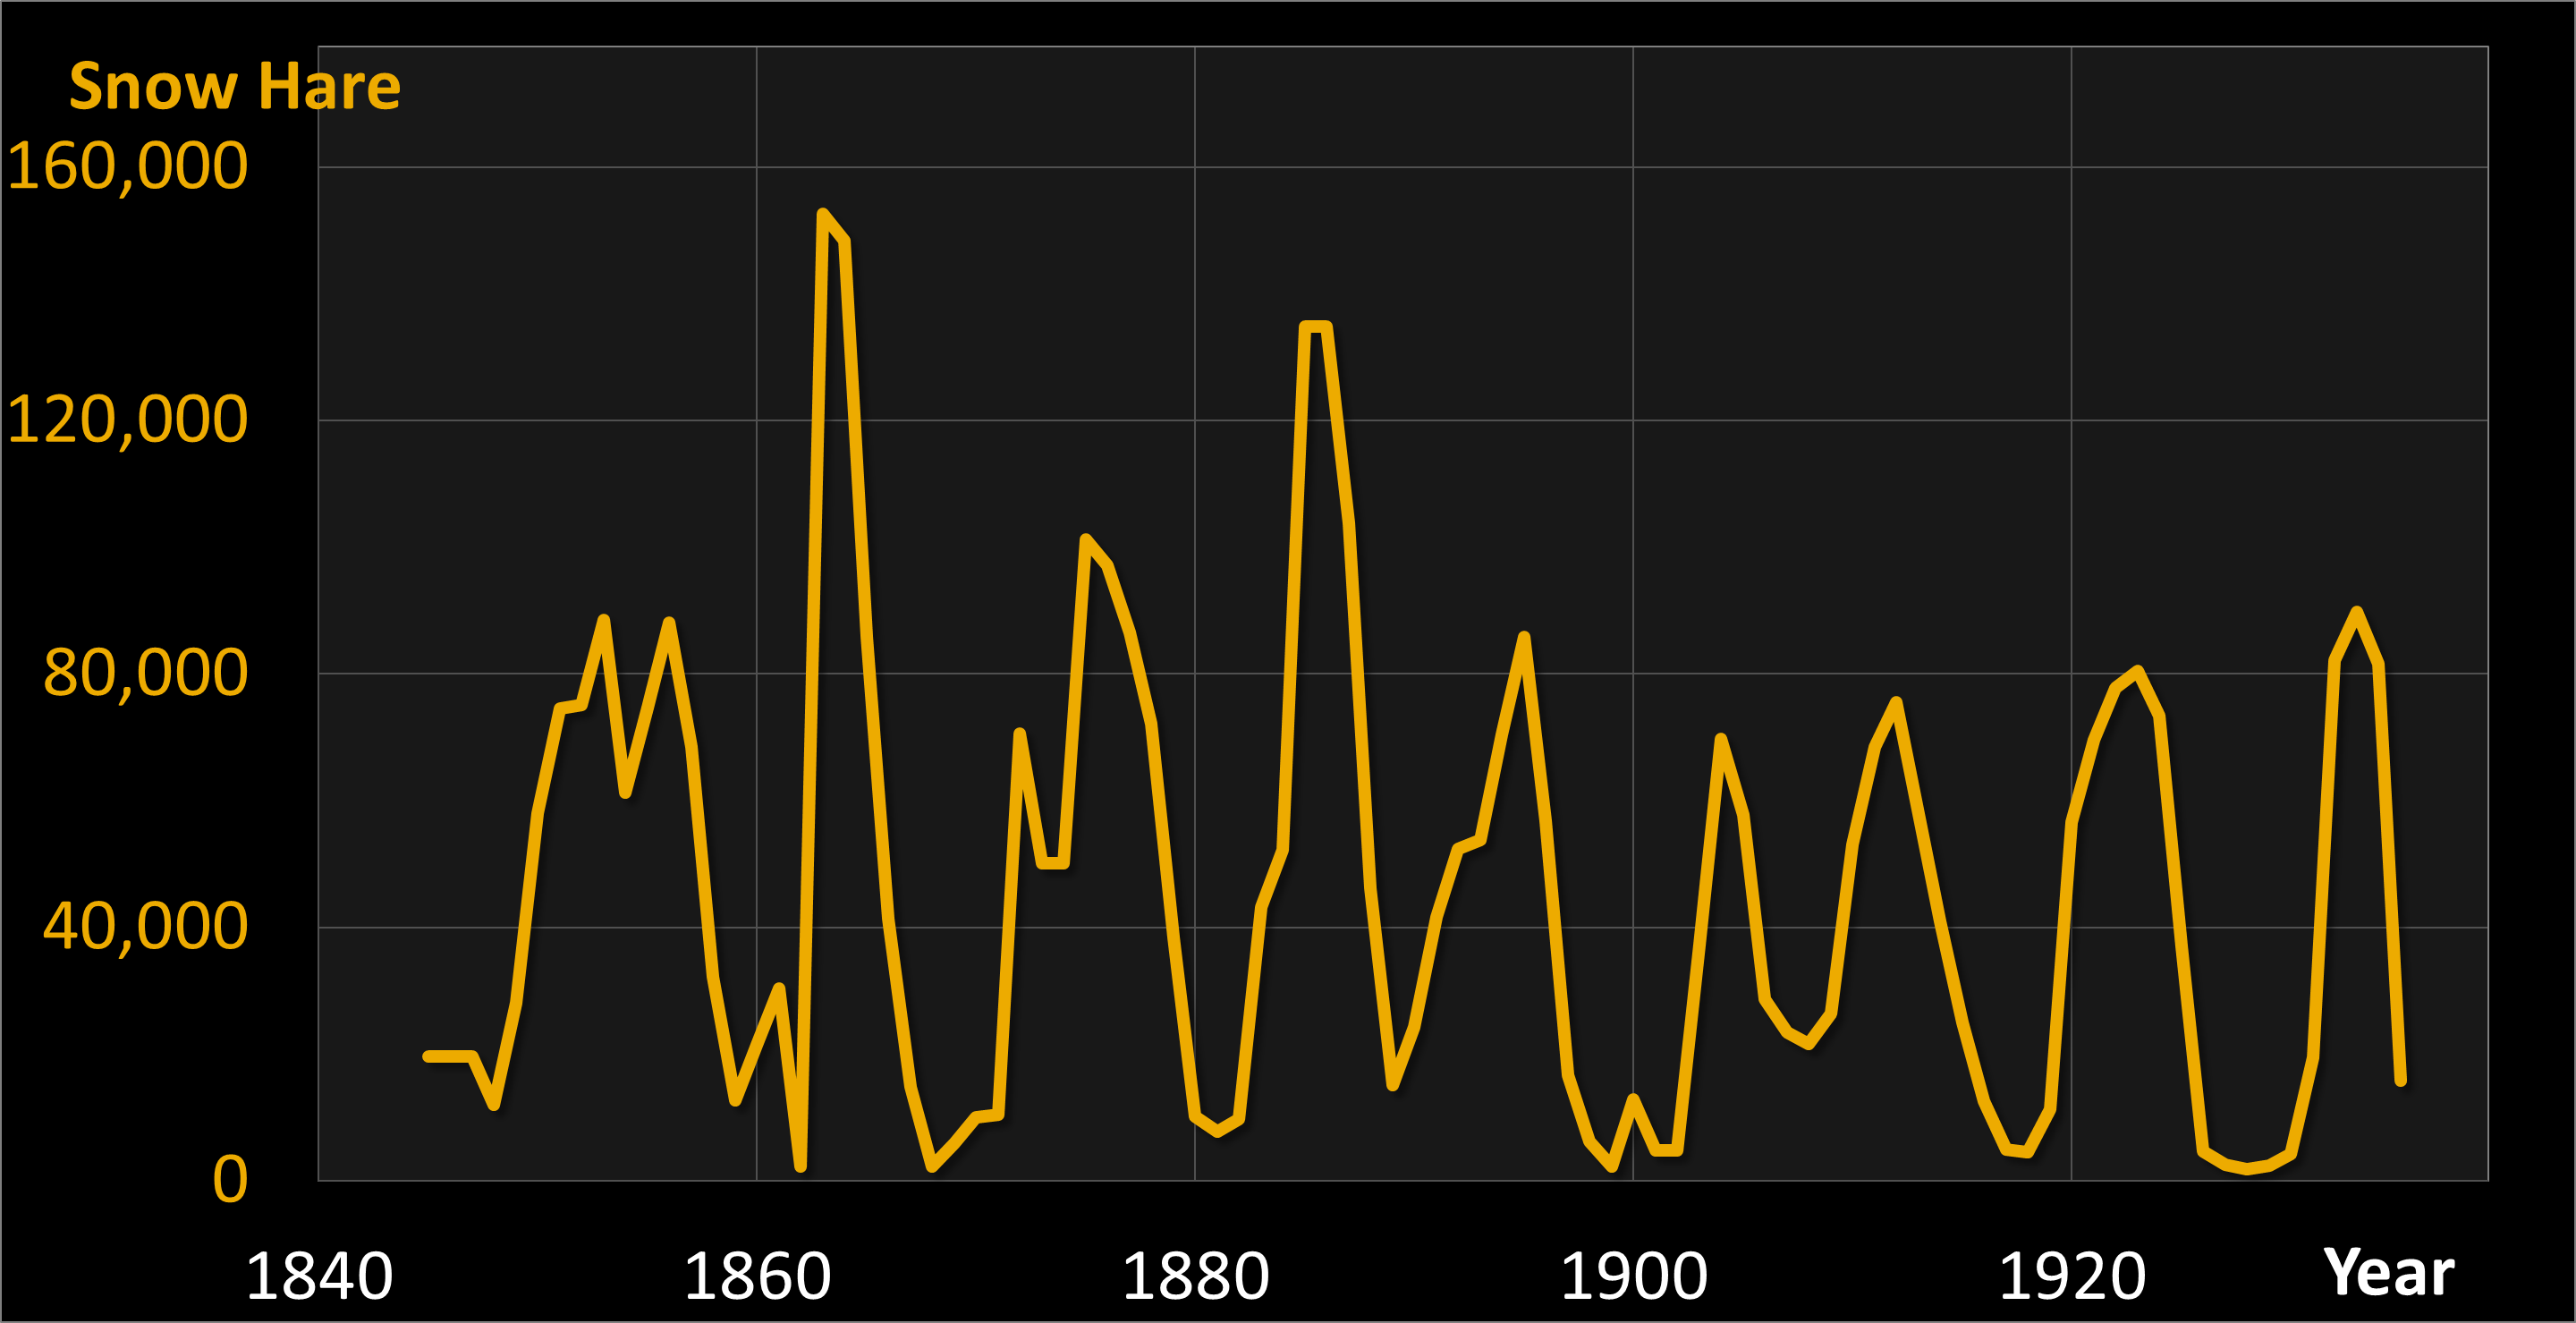
Unfortunately, not much research is available on this subject, partly because it is almost impossible to find an ecosystem in which the two groups of animals can control each other without all kinds of other influences. There is one rather famous example, where the numbers of Canadian lynxes and snow bunnies over a period of almost a hundred years have been derived from the sale of pelts to the Hudson Bay Company. How reliable that method is is rather questionable, but it is the best available.
Sources:
Mac Lulich, Duncan Alexander (1937): Fluctuations in the numbers of varying hare (Lepus americanus). University of Toronto Press.
Odum, Eugene P. (1953): Fundamentals of Ecology. W.B. Saunders, Philadelphia.
Kirby, Michael J. & Dangelmayr, Gerhard (2003): Mathematical Modeling, A Comprehensive Introduction. Prentice Hall, New Jersey.
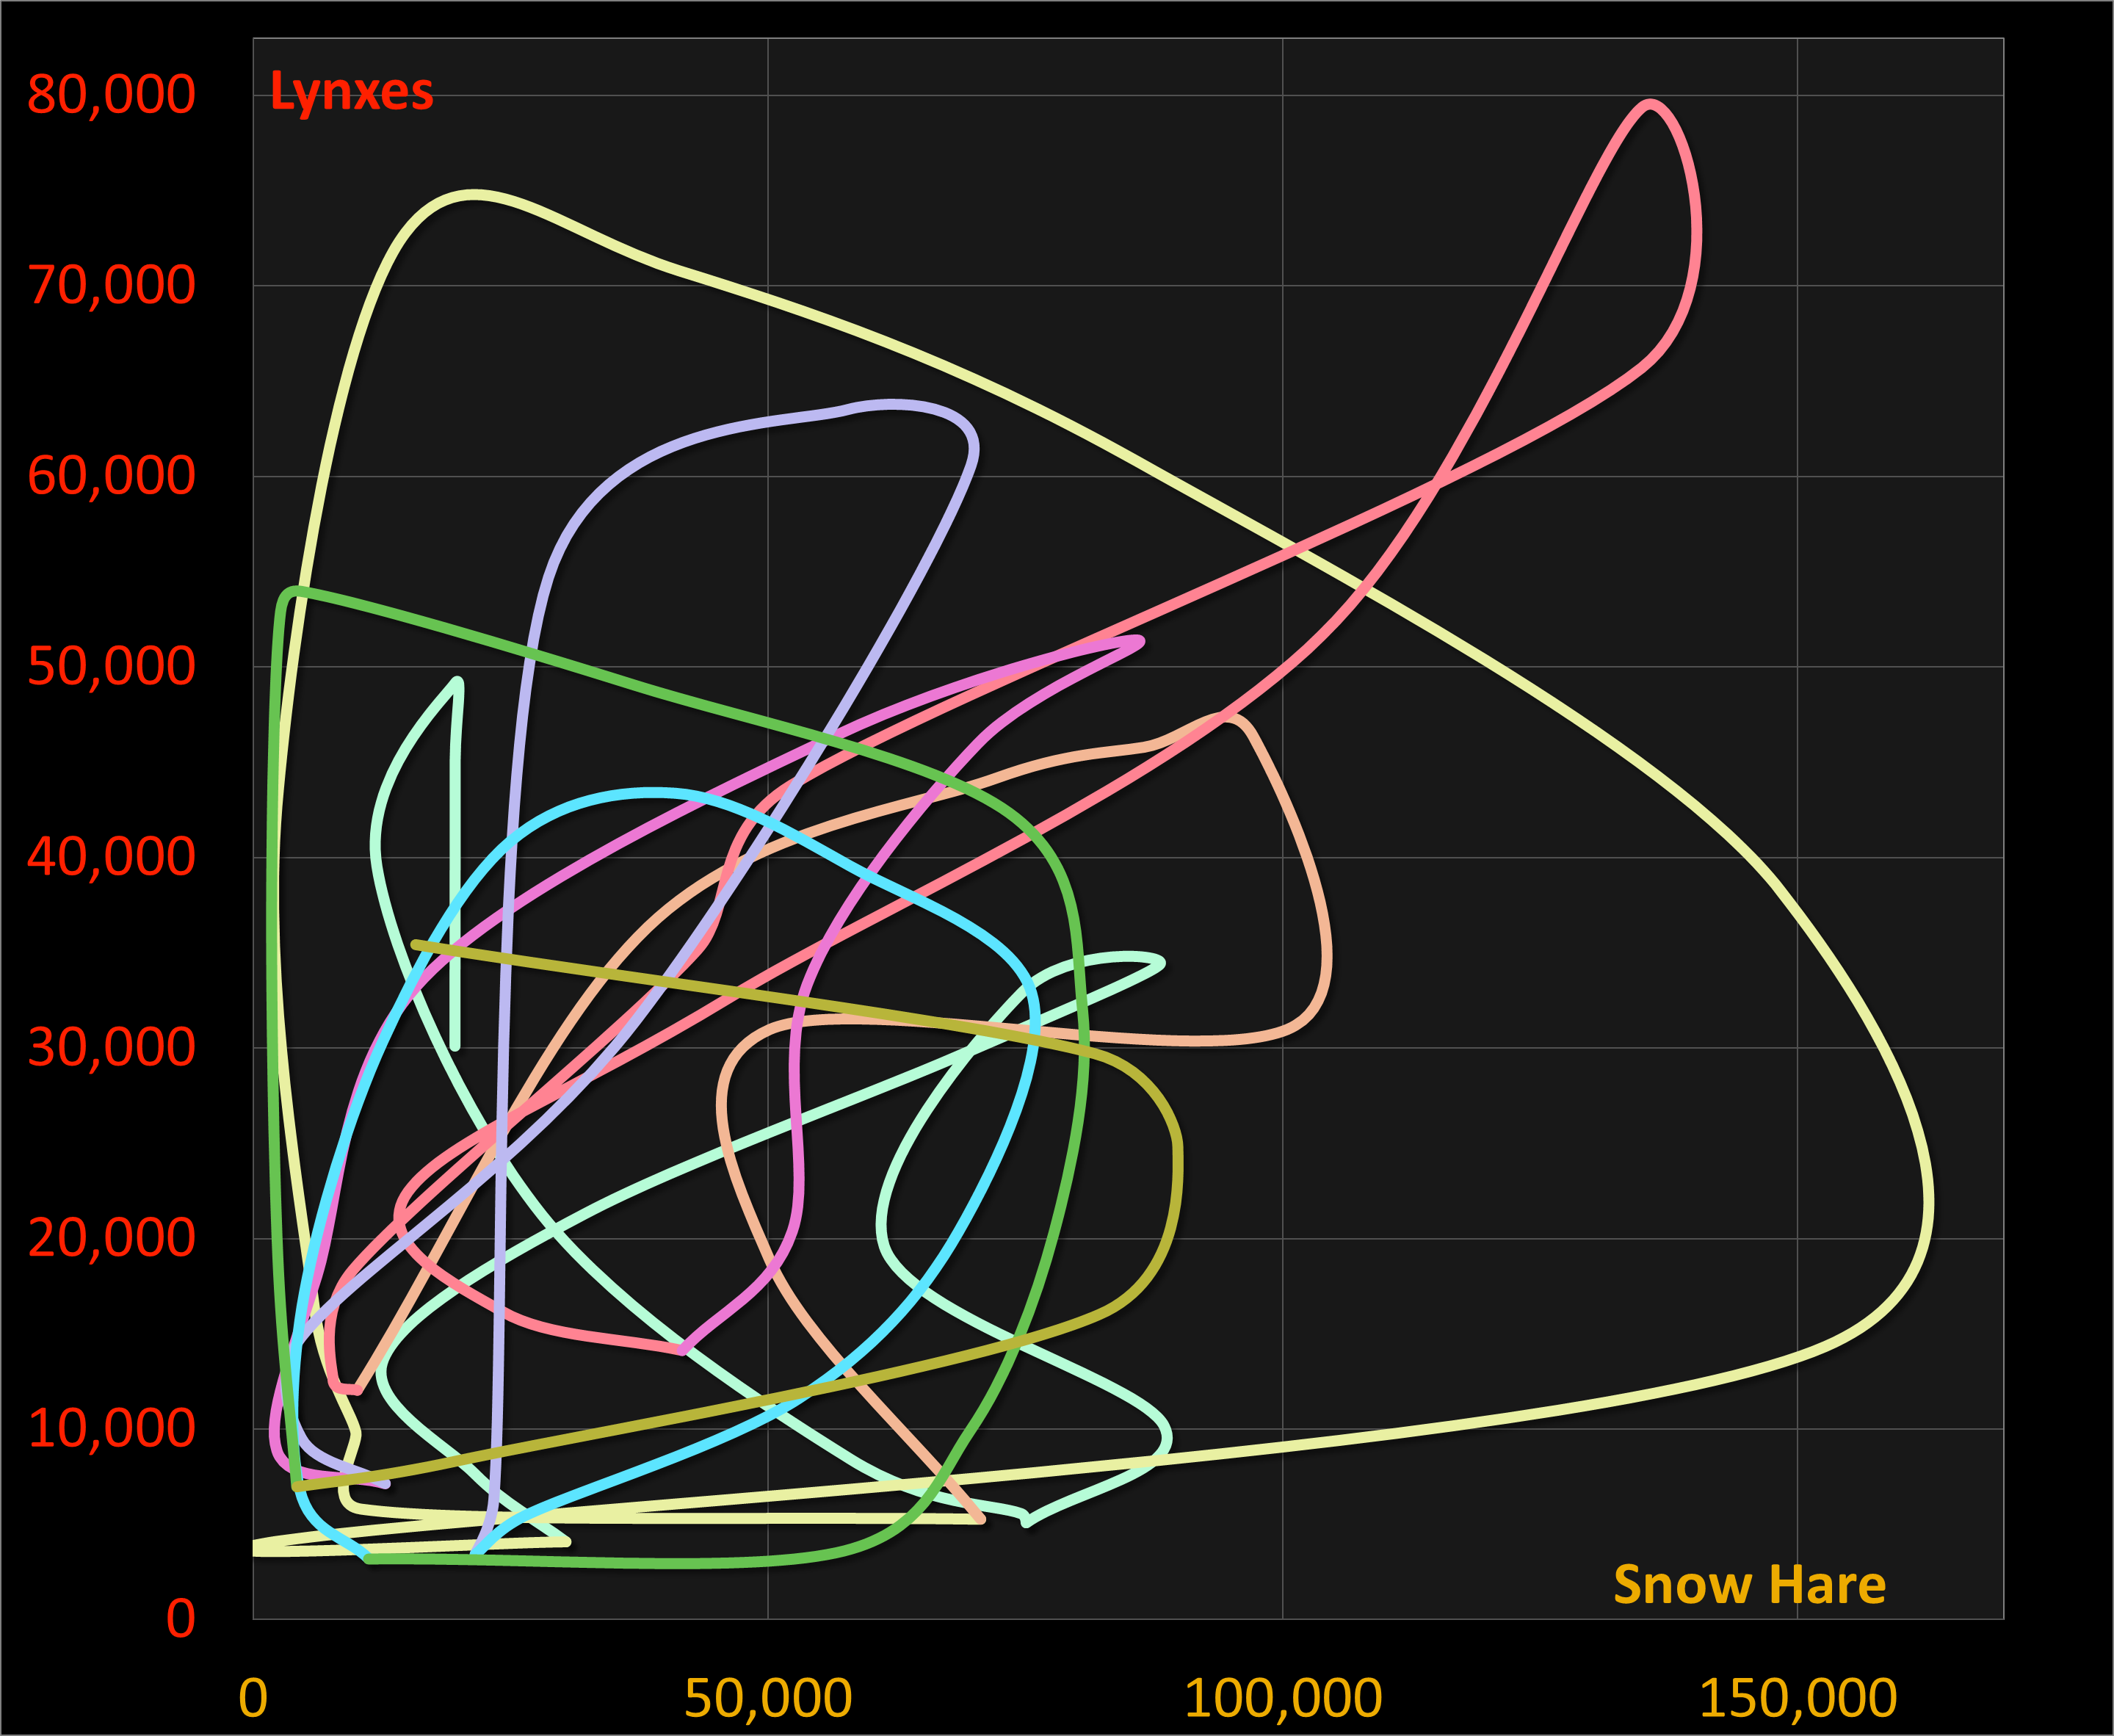
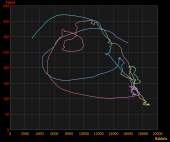
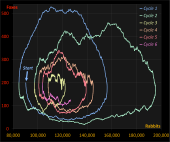
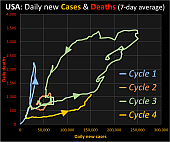
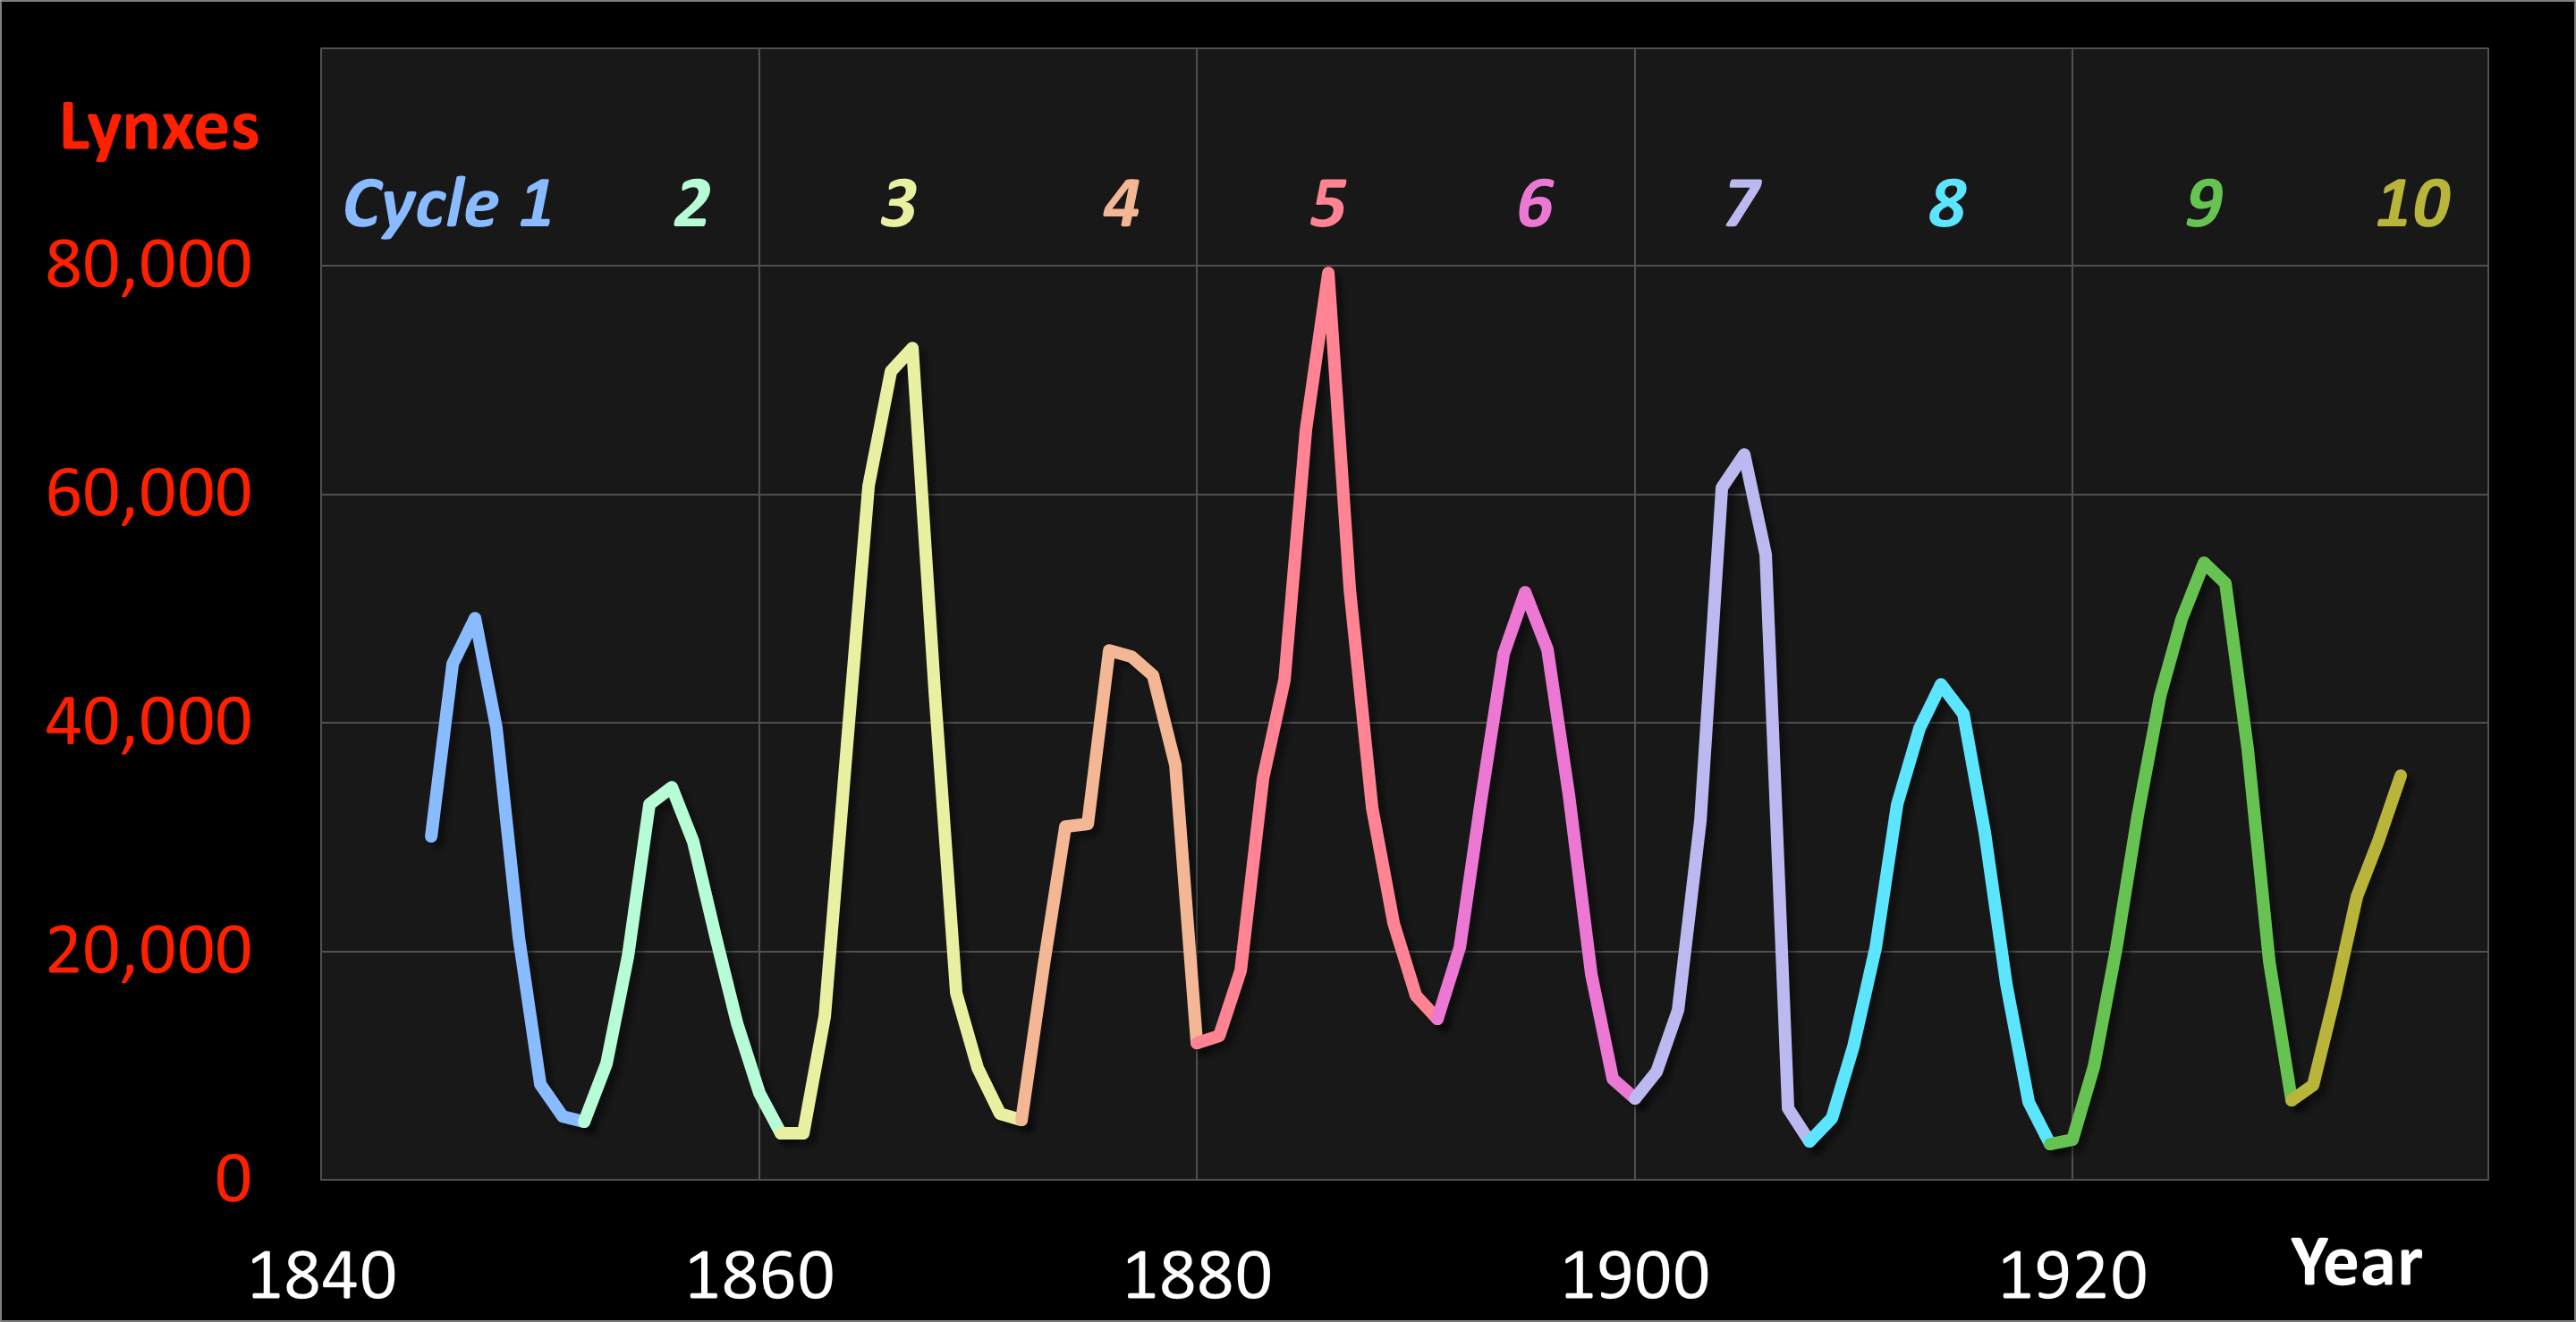
For what it's worth, the results are shown here, first as a phase diagram, then as a set of two time charts. The cycles are numbered and colored, just as in the phase diagram of the Field Model.
In the diagrams, a certain degree of cyclicity can be observed over a period of about ten years, with the lynx 'lagging behind' (following) the snow hare, which is fascinating: it matches the theoretical expectations.
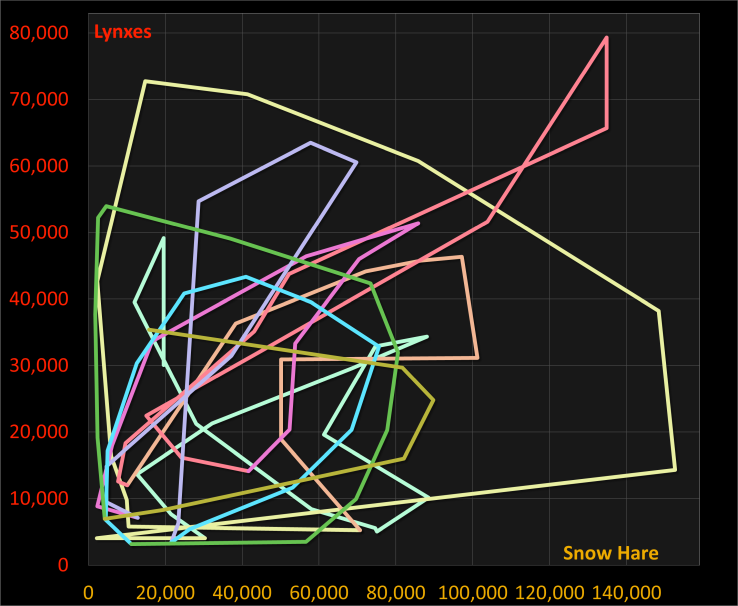
The curve of the phase diagram looks rather angular: it apparently consists of quite a number of long straight line segments. This is not realistic: there is a good chance that, if much more observation data were available, the phase diagram would look much more like that of the foxes and rabbits of the theoretical Field Model.
Therefore, a second variant of the phase diagram, consisting of flowing lines, as shown here, is exactly as (un)reliable as the first one - based on the limited available data.
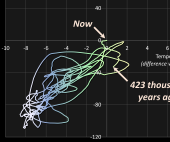
Studying the rise and fall of prey & predator numbers is one thing: it is primarily relevant for ecologists. How about some other topics, that are absolutely quintessential for every human and non-human being? On the next page, you will study the consequences of Ice Ages and Climate Change.